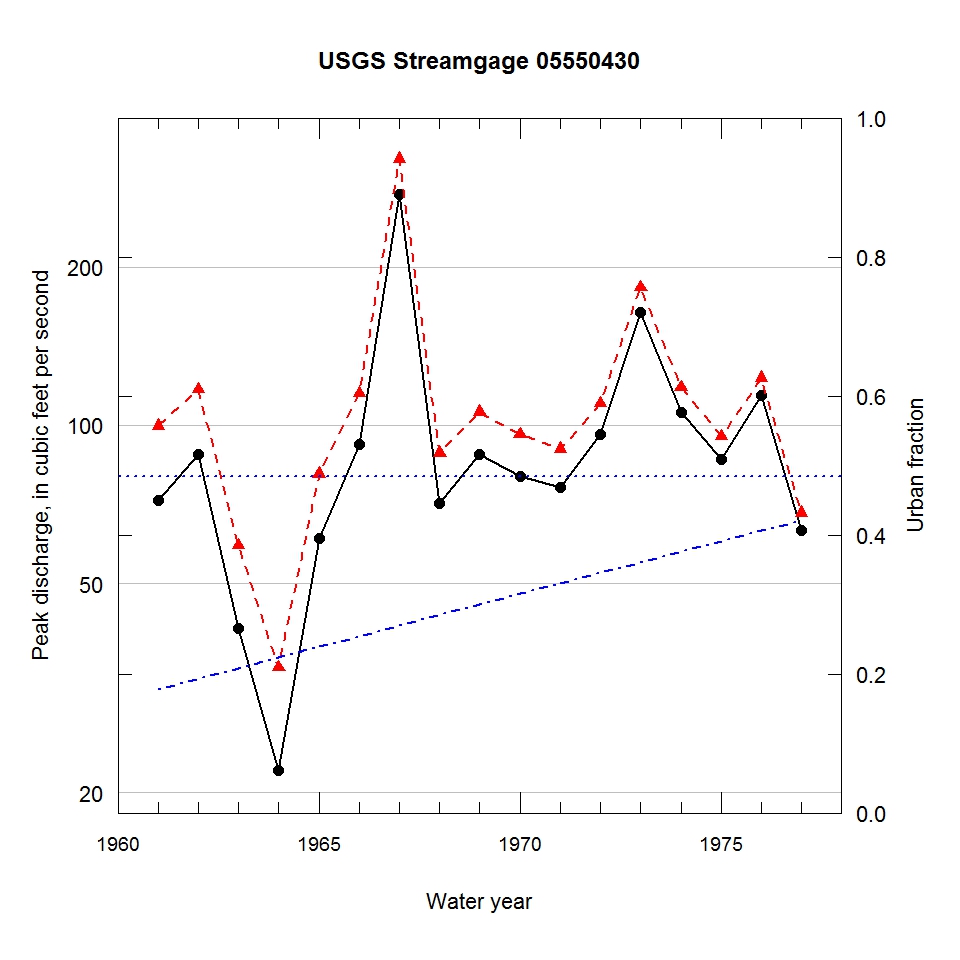
Observed and urbanization-adjusted annual maximum peak discharge and associated urban fraction and precipitation values at USGS streamgage:
05550430 EAST BRANCH POPLAR CREEK NEAR PALATINE, IL


| Water year | Segment | Discharge code | Cumulative reservoir storage (acre-feet) | Urban fraction | Precipitation (inches) | Observed peak discharge (ft3/s) | Adjusted peak discharge (ft3/s) | Exceedance probability |
| 1961 | 1 | -- | 633 | 0.178 | 1.270 | 72 | 100 | 0.383 |
| 1962 | 1 | -- | 633 | 0.193 | 0.269 | 88 | 117 | 0.259 |
| 1963 | 1 | -- | 633 | 0.208 | 2.007 | 41 | 59 | 0.774 |
| 1964 | 1 | -- | 633 | 0.224 | 3.865 | 22 | 35 | 0.941 |
| 1965 | 1 | -- | 633 | 0.239 | 0.579 | 61 | 81 | 0.561 |
| 1966 | 1 | -- | 633 | 0.254 | 0.559 | 92 | 115 | 0.269 |
| 1967 | 1 | -- | 633 | 0.270 | 1.226 | 275 | 321 | 0.012 |
| 1968 | 1 | 2 | 633 | 0.285 | 4.144 | 71 | 89 | 0.482 |
| 1969 | 1 | -- | 633 | 0.300 | 2.457 | 88 | 106 | 0.332 |
| 1970 | 1 | -- | 633 | 0.316 | 2.866 | 80 | 96 | 0.415 |
| 1971 | 1 | -- | 633 | 0.331 | 0.240 | 76 | 90 | 0.468 |
| 1972 | 1 | -- | 633 | 0.346 | 1.748 | 96 | 110 | 0.301 |
| 1973 | 1 | -- | 633 | 0.361 | 2.197 | 164 | 183 | 0.065 |
| 1974 | 1 | -- | 633 | 0.376 | 1.128 | 106 | 118 | 0.252 |
| 1975 | 1 | -- | 633 | 0.391 | 1.847 | 86 | 95 | 0.423 |
| 1976 | 1 | -- | 633 | 0.406 | 1.887 | 114 | 123 | 0.224 |
| 1977 | 1 | -- | 633 | 0.421 | 1.598 | 63 | 68 | 0.690 |

